|
Charts Panel Flash Presentation 
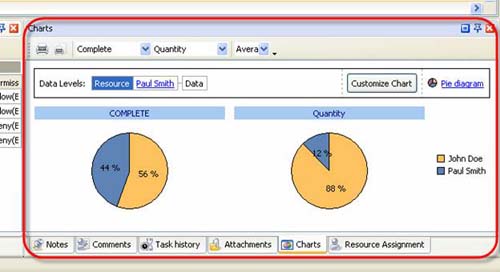
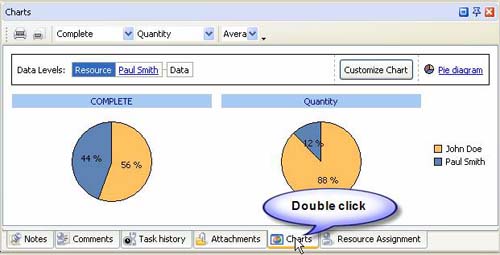
Charts panel displays field"s values of the tasks in the form of diagram.
By default Charts panel is located at the right bottom part of application window.
Tips:
-
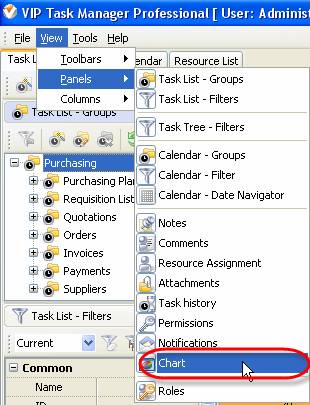
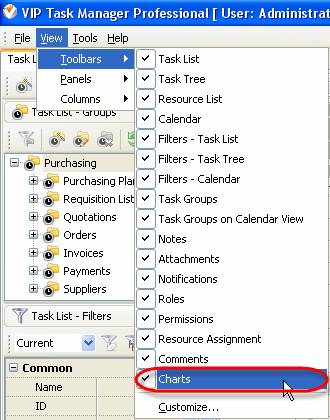
To display or hide Charts panel use main menu command [View -> Panels -> Charts].
-
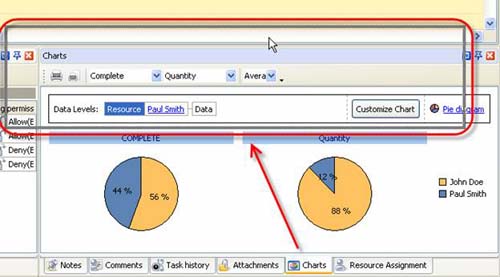
To move Charts panel drag it and drop where you need. There must be a gray frame that shows panel"s future location while dragging it
-
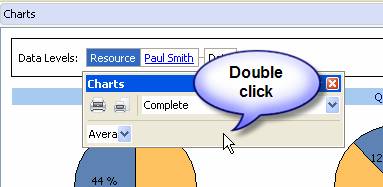
To take Charts panel out its default location double click on its tab.
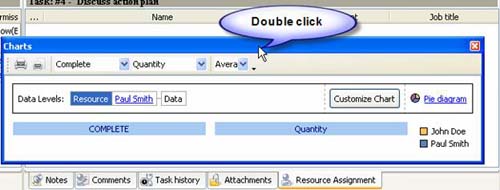
To return Charts panel to its default location double click on its title.
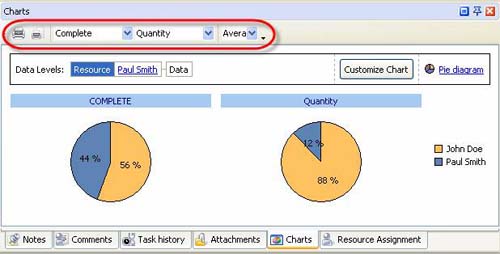
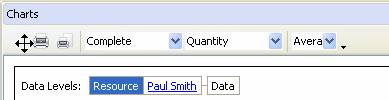
Charts Toolbar
By default Charts toolbar is located at the left top part of Charts panel.
The following table describes each of the Charts Toolbar buttons.
Button |
Description |

|
Print out the diagrams |

|
Preview the diagrams , create and edit your own print design |
|
Select the field for creating the first diagram |
|
Select the field for creating the second diagram |

|
Select the type of calculation that should be displayed on the diagram |

|
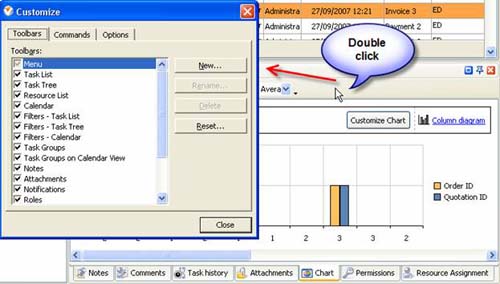
Add or remove buttons to Chart Toolbar |
Tips:
-
To display or hide Charts Toolbar use main menu command [View -> Toolbars -> Charts].
-
To move Charts Toolbar move mouse cursor to its left border, left click on it while cursor has its "crosshair" status, drag and drop it wherever you need.
-
To take Charts Toolbar out its default location and vice versa double click on it.
Customization zone
Customization zone is located under Charts toolbar.
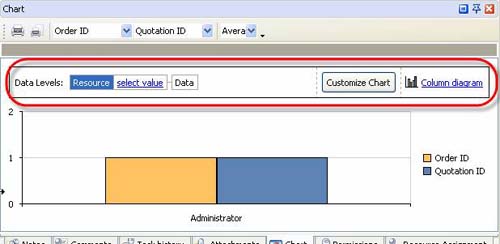
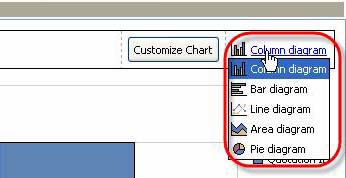
On the right of the Customization zone there is an option that allows to select column, bar, line, area or pie type of the diagram.
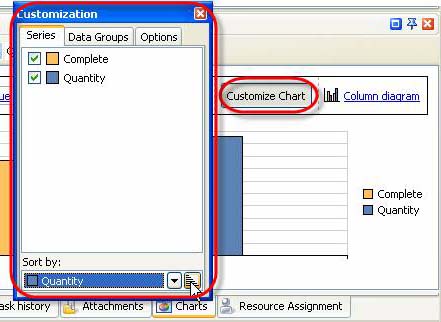
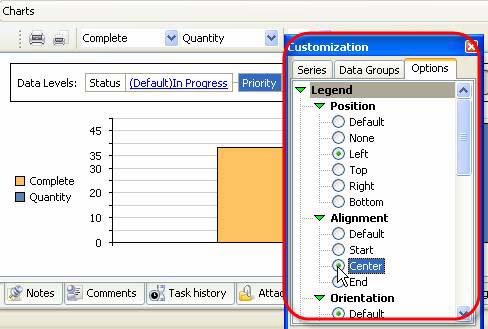
Left click on "Customize Chart" button allows to display or hide diagrams, sort the data on the diagram in ascending or descending order, display or hide Data levels and set the appearance of the legend, titles and Customization zone.
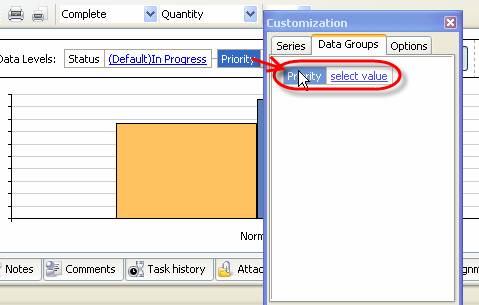
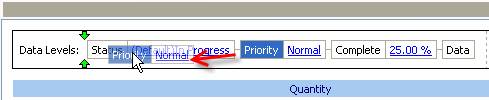
"Data Levels" block allows to plot the diagrams for various values of the particular task fields by which the tasks are grouped on the grid.
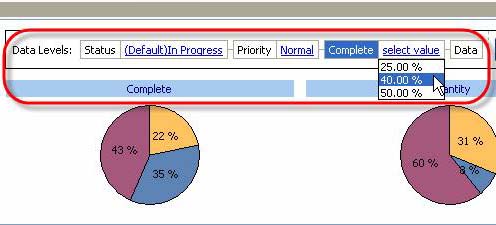
The order of drill down diagrams can be changed by Drag & Drop method. The level of displayed data can be changed by selecting required field on "Data Levels" box.
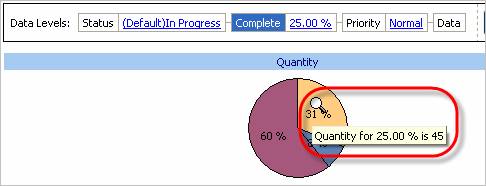
Charts field
Directing the cursor at the field of the diagram allows to watch the screen tips with the name of the field and the number of the tasks with each field value. Left click on the diagram allows to display the diagram of the following level, right click allows to return one level up.
Tips:
|


 Play Demo
 Try It FREE